newsimpactscreener logonewsimpactscreener
Insights
ArticlesTopicsQuotesThe ArenaFamous TradersResearch
Free services
Daily News BriefingMarket Screenings
PricingDocsBlogChangelogSign inSign up
newsimpactscreener logonewsimpactscreener
Insights
ArticlesTopicsQuotesThe ArenaFamous TradersResearch
Free services
Daily News BriefingMarket Screenings
PricingDocsBlogChangelogSign inSign up
newsimpactscreener— news connected to markets.
@newsimpactscrnr on X@newsimpactscreener on InstagramAboutBriefingsTermsPrivacy
newsimpactscreener logonewsimpactscreener
Insights
ArticlesTopicsQuotesThe ArenaFamous TradersResearch
Free services
Daily News BriefingMarket Screenings
PricingDocsBlogChangelogSign inSign up
For retail & self-directed investors

Catch market-moving news before it hits the crowd.

See what a share price already pays for — and what it refuses to pay for — before you take the other side. Free, no account. Plus two tools that bring the signals to you.

Free — no card requiredTelegram & email deliverySee how it works →

Start free in seconds — pick one, or all three

Narrative trading

No account

Open any ticker and read the story its price already tells: what the market is paying for, what it declines to pay for, and the one question that settles it.

Read a price narrativeStart with AAPL
or

Free market screenings

Curated screeners

Platform-run Stage 2 setups, breakouts and fundamentals. Subscribe once; results hit your inbox.

Set up screeningsDownload latest momentum picks (CSV)
or

Your own personal briefing

Daily PDF · pre-open

You choose the exact tickers and tags — we send a daily PDF of just their news, summaries and market impact, an hour before the open. Built around your watchlist, no one else’s.

Build my briefingDownload a sample (PDF)
AI chip demand surgeRate cut expectationsEnergy supply pressureChina EV competitionCloud hyperscaler capexReshoring manufacturingDefense spending outlookConsumer credit stressBiotech regulatory cycleDollar strength impactAI chip demand surgeRate cut expectationsEnergy supply pressureChina EV competitionCloud hyperscaler capex

See it first

Real output, before you sign up

A genuine sample of each free tool — the morning briefing PDF, the latest momentum screening, and a live price narrative. No account needed.

news-briefing-Jun 11, 2026.pdfDaily PDF

Sample briefing

Tap to view the PDF

Open full briefing →
Build my briefing

Narrative trading

Every price is a story the market already believes

A share price is a vote on a set of claims. Narrative trading is reading that vote before you take the other side — what the price already pays for, what it refuses to pay for, and the single question that settles the difference. We reconstruct it from every published analyst model on the name, the reported segments and a reverse-DCF. Free on 543 tickers, no account.

  1. 01

    Read what the price already pays for

    Anything widely reported is already in the number. Buying a story everyone has read is paying full price for old news.

  2. 02

    Find what it refuses to pay for

    The rejected models are the opportunity. They name the specific upside — and downside — the market is currently declining to fund.

  3. 03

    Trade the one claim that settles it

    Most disagreements come down to a single variable. Know which one, and you know exactly which headline to act on and which to ignore.

AA

AAPL

20 published analyst models · as of 2026-08-31

Worked example

Where the price sits

How it works

Three steps, no terminal

  1. 01

    Follow the themes heating up

    Track narratives as they build—AI infrastructure, rate expectations, energy policy—before they become headlines everywhere.

  2. 02

    See which stocks and sectors are most exposed

    Get a clear picture of which companies sit closest to a story so you know where to look, not just what happened.

  3. 03

    Narrow ideas that match how you invest

    Filter by the factors you care about—growth, value, sector, risk—and keep your process consistent without manual spreadsheets.

Why it works

Built for how retail investors actually research

You don't need a desk full of monitors. Follow themes, see exposure, and narrow ideas—before the market has already moved.

Get signals before everyone else does

Cut through endless headlines. See which stories and themes are gaining traction so you know what to read first—without a terminal or a research team.

Link headlines to the stocks you already own

Turn "what's everyone talking about?" into "what might affect the names in my brokerage or IRA?"—before the connection is obvious everywhere else.

A steadier process. Fewer rabbit holes.

Whether you check in daily or on weekends, less doom-scrolling, fewer "what did I miss?" moments, and a shorter path from headline to decision.

What you get

Signal, not noise

Themes, not just tickers

Watch how narratives build over time so you're not reacting to every headline in isolation—or missing the ones that actually matter.

Exposure, in plain terms

Get a clear picture of which companies and industries sit closest to a story—before the market has priced it in.

Screen the way you think

Focus on the factors that matter to you—growth, value, risk, sectors—and keep your process consistent without spreadsheets you maintain by hand.

Free market screenings

Curated screenings, free to subscribe

Platform-managed screenings — Stage 2 setups, technicals, fundamentals — run on a schedule. Subscribe once and the results land in your inbox and Telegram, no setup required.

relationship-graphAt 07:00 AM, Monday through Friday (Europe/Copenhagen)

Second-Order Chain

When a big story hits one company, the company economically attached to it often has not reacted yet. This board reads the platform's 38,000-edge relationship graph — typed, directional, evidence-backed supplier / customer / partner / competitor links extracted from news — and finds those un-reacted neighbours. The hard part is not finding connections; it is the three ways this strategy loses, each of which is a filter here rather than a judgement call: 1. THE NEIGHBOUR HAS ALREADY MOVED. This is a PRICE question, not a news question — sympathy selling moves a stock without generating a single article, so quiet coverage proves nothing. Each candidate's return over the window is compared with the headline's, and anything that has already collected a meaningful share of the move (in either direction) is dropped. 2. THE SIGN IS BACKWARDS. Edge direction in the graph is unambiguous — `from -[supplier]-> to` means from SUPPLIES to — so the rule is arithmetic: everyone in a value chain moves WITH the headline, a competitor moves AGAINST it. 3. THE EDGE IS TOO SMALL TO MATTER. A real relationship touching 2% of revenue is a fact, not a trade. Edges are gated on strength and on how many independent articles asserted them. Pipeline: 1. Headline names: enough coverage in the last few days to be a real story, and either a strongly one-directional sentiment reading or a large price move. Both are reported, because they disagree more often than you would expect — one recent story ran at +0.31 average sentiment across 75 articles while the stock fell 15%, and a sentiment-only screen would have pointed the wrong way. 2. Neighbours: every graph edge above a strength and mention floor, deduplicated to ONE edge per pair (the graph stores both directions and sometimes several types for the same pair). 3. Tradeable: US-listed and liquid enough to enter and exit; the raw graph contains foreign listings that no order could fill. 4. Sign, then the not-yet-moved test. 5. Contradictions dropped: a name that two live stories push in OPPOSITE directions is removed rather than resolved, because it has no second-order edge left. Several stories pushing the same way are kept as corroboration. Each row carries the headline and its move, the neighbour and its move, the share of the move already captured, the edge type / strength / evidence count, and the resulting side.

Pricing

Lock in the founder rate.

Price increases every 100 subscribers. Early subscribers lock in their rate forever.

Free to explore until launch. The full platform is free of charge while we're in early access. The rates below only kick in at launch — and founders who sign up now lock theirs in for life.
Phase full102 / 100 taken
$9/ month
Save 77%

$99/yr · lock in forever

Real-time screening, locked at this price for life.

  • Real-time news impact screener
  • Full impact score breakdown
  • Sector & theme filters
  • Watchlist alerts
  • 7-day history
Lock in $9/mo

Your price is locked for life. Cancel any time — but once you cancel, the founder rate is gone.

Straight answers

Common questions

Who it's for

Retail and self-directed investors who manage their own accounts—taxable brokerage, IRA, or both—and want news tied to opportunities, not noise.

How it's different

Most screeners start with static filters. News Impact Screener starts with what's happening in the world and shows what it might push on in the market—so you're not the last to know.

Why it helps

What would it mean to catch major news before everyone else? Less scrambling, fewer "I should have seen that coming" moments, and a watchlist you actually understand.

Early access

Not ready to be the last to know?

It seems like you want fast, reliable insight—without digging through hours of news. Join the list and get signals before the market reacts. Built for people who invest their own money and want context, not chaos.

Free. No spam. Takes 30 seconds.

Reshoring manufacturing
Defense spending outlook
Consumer credit stress
Biotech regulatory cycle
Dollar strength impact
PDF
nis-momentum-2026-09-04.csvLive screen
SymbolSectorSub SectorRS Rank
CVEEnergyOil & Gas Integra…87
MTLSTechnologySoftware - Applic…87
STechnologySoftware - Infras…87
WEXTechnologySoftware - Infras…87
ALLFinancial ServicesInsurance - Prope…88
AMNHealthcareMedical - Care Fa…88
ATKRIndustrialsElectrical Equipm…88
BNSFinancial ServicesBanks - Diversifi…88
Open screening →
Set up screeningsCSV
aapl-narrative-2026-08-31Live read
AA

AAPL

20 published analyst models

$245median $360$400$320 today

The market is 11% below the median target — more cautious than the analysts.

Agree with the price
3
within 8%
Say it's too cheap
4
15%+ higher
Say it's too dear
4
15%+ lower
Read the narrative →
Browse narratives543 tickers
$245median $360$400$320 today

The market is 11% below the median target — more cautious than the analysts.

Agree with the price
3
within 8%
Say it's too cheap
4
15%+ higher
Say it's too dear
4
15%+ lower

The price sits at the 25th percentile of the 20 published models, leaning bearish versus the median $360 target, and requires revenue growth of 17.3% annually—far above the 6.4% just delivered—meaning the market is already paying for significant acceleration.

The price pays for

  • Stable iPhone and Services revenue at current growth rates (4.2% and 13.5% YoY), which are endorsed by the near-consensus models clustered 8-15% above the price.
  • Sustained high profitability, with the price assuming a 23.7% free cash flow margin continues indefinitely.
  • Ongoing component cost pressures and supply constraints, which are widely circulated and explicitly factored into the bear-case models the price rejects.

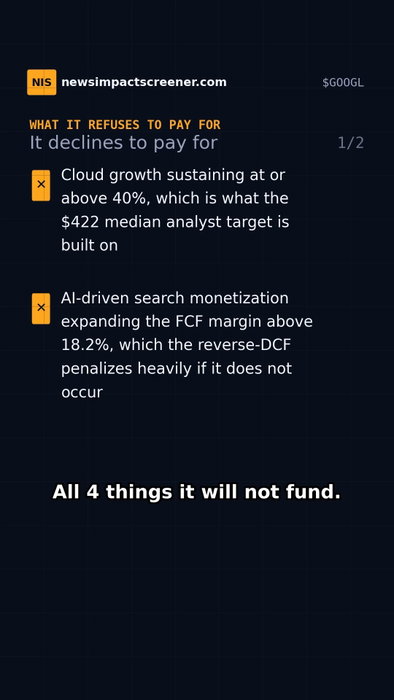
The price refuses to pay for

  • The full bull-case AI and services monetization upside, which the four rejected models at $375-$400 value at up to 25% above the current price.
  • The bear-case margin compression and growth stall, which the four rejected models at $245-$264 argue could remove 18-23% from the current price.

What the disagreement turns on

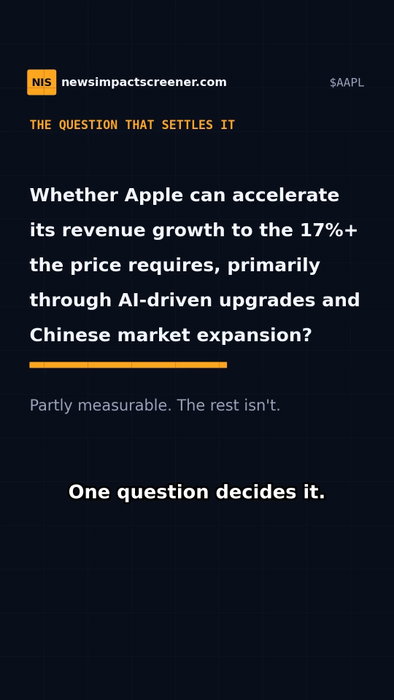
Whether Apple can accelerate its revenue growth to the 17%+ the price requires, primarily through AI-driven upgrades and Chinese market expansion, which can only be partially settled by tracking consumer attention and unit volumes.

Read AAPL’s full narrative

Written by a language model from the published models, the reported segments and a reverse-DCF — not a recommendation, and not a house view.

Also reconstructed and free to read

CPBDOCCPASMTCSMPLGOLDOSDTEGPCENTGGTLBHALOLTHTYLSAILALGTEVRCSGPall 543 →
View screening →
fundamental-sentimentAt 07:00 AM, Monday through Friday (Europe/Copenhagen)

Burry Deep Value

Michael Burry's documented method, run on both sides of the book. Half of it is a conventional value screen — EV/EBITDA (industry-relative, as Burry describes it), free cash flow, low debt, enterprise value rather than market cap. The other half is the part a conventional screener cannot run at all: Burry looked for "ick" stocks that provoke revulsion, and for the neglected — "unpopular companies that look like road kill". Those are facts about ATTENTION and SENTIMENT, and this platform measures both per ticker per day. Over a 90-day window across ~3,885 covered tickers, sentiment runs p10 -0.28 / median +0.41 / p90 +0.80. It skews strongly positive, so a negative reading is genuinely rare — which is what makes "ick" a discriminating gate rather than a mood. Pipeline (cheap gates first; the fundamental step costs one API call per survivor): 1. Attention gates, one query. LONG — 90-day average sentiment below zero AND mention count inside a neglect band (enough coverage to be real, little enough to be ignored). SHORT — sentiment above +0.60 AND heavily covered. 2. Liquidity floor: enough price and volume to take and exit a position. 3. Value gates, per survivor: LONG — EV/EBITDA under a SECTOR-relative ceiling (tech 18x … energy 8x), free cash flow yield above 4%, net debt / EBITDA under 3.5x. SHORT — EV/EBITDA above 1.5x the sector ceiling AND free cash flow yield under 2%: rich on the multiple and not generating the cash to justify it. A rich multiple on strong cash flow is a good business, not a short. 4. Rare-bird flag (not a gate): working capital per share above the price — Burry's "selling at less than two-thirds of net value". Flagged when found, because those deserve longer holding periods. 5. Margin of safety, where available: the priced-in programme's reverse-DCF. median_gap says where the price sits against published analyst models; implied_revenue_cagr says what growth the price REQUIRES. Only ~476 names carry one, so it annotates rather than gates — requiring it would cap the board at the large-cap end and exclude exactly the neglected names the screen exists to find. NO market-regime gate, unlike NIS Short. Gating on the S&P's 200-day is O'Neil's timing discipline; Burry is early on purpose and holds through the drawdown. This is deliberately NOT the NIS Short method. That board shorts former leaders in a Stage-4 breakdown, entered 5-15 weeks after the top. This one shorts what is expensive, adored and crowded while it is still going up. Known gap: short interest / days-to-cover is not available, so squeeze risk on the short side is unscreened — the same hole NIS Short documents. Rows carry a `side` field so one run answers both questions.

View screening →
ThematicAt 07:00 AM, Monday through Friday (America/New_York)

Inflation Winners

Stocks positioned to benefit from persistently high inflation and higher-for-longer rates — precious metals, energy, commodities & materials, pricing-power staples, energy infrastructure, rate-beneficiary financials and inflation-protected proxies — each validated by price momentum and real inflation-news exposure.

View screening →
Browse all market screenings →

Instagram

Markets, in your feed

Daily regime reads, top-story breakdowns, and watchlist setups — the screener's signal, in 30 seconds a day.

Follow @newsimpactscreener
google's cloud grew 82% this quarter. fifth straight quarter it accelerated. the stock fell 8%.

amazon did the same thing — AWS +36.7%, a $496B backlog growing triple digits. down 4%.

those were the best cloud numbers of the entire cycle and both of them got sold.

meanwhile:

PLTR +39.2%
ANET +7.0%
NVDA +5.3%

notice what those three have in common. they all sell TO google and amazon.

google and amazon announced $425B of capex between them. the market stopped paying whoever spends the AI money and started paying whoever receives it.

being the customer is the bad trade right now.

the part nobody expected: western digital beat on revenue AND earnings and still finished -16.9% — into a DRAM shortage that's forecast to get worse through 2027.

a shortage is only good for you until your customer goes shopping for more suppliers.

nvda reports the 26th. that's when the whole thesis gets marked to market.

google's cloud grew 82% this quarter. fifth straight quarter it accelerated. the stock fell 8%. amazon did the same thing — AWS +36.7%, a $496B backlog growing triple digits. down 4%. those were the best cloud numbers of the entire cycle and both of them got sold. meanwhile: PLTR +39.2% ANET +7.0% NVDA +5.3% notice what those three have in common. they all sell TO google and amazon. google and amazon announced $425B of capex between them. the market stopped paying whoever spends the AI money and started paying whoever receives it. being the customer is the bad trade right now. the part nobody expected: western digital beat on revenue AND earnings and still finished -16.9% — into a DRAM shortage that's forecast to get worse through 2027. a shortage is only good for you until your customer goes shopping for more suppliers. nvda reports the 26th. that's when the whole thesis gets marked to market.

View
alphabet’s cloud grew 82% this quarter. fifth straight quarter it accelerated. the stock fell 8%.

amazon is sitting on a $496B backlog growing in triple digits. AWS up 36.7%. down 4%.

those were the best cloud numbers of the entire cycle and both of them got sold.

the week:

PLTR +39.2%
ANET +7.0%
AVGO +6.1%
NVDA +5.3%
MU +4.7%
AMD -2.1%
AMZN -4.1%
GOOGL -8.0%
WDC -16.9%

and the index barely moved. SPY +1.7%. QQQ +2.6%.

here’s what actually separated them. it wasn’t growth — google and amazon printed the best numbers on the board. it was which side of the invoice you’re on.

google and amazon announced $425B of combined capex between them. they are the ones writing the cheques. both got sold.

palantir, arista and nvidia get paid out of exactly that budget. all three went up. palantir did 93% revenue growth and $0.41 against $0.28 expected.

the market stopped paying the companies spending the AI money and started paying the ones receiving it.

the part nobody expected: western digital beat on revenue AND earnings and fell 11% after hours. down 16.9% on the week. this is into a DRAM shortage forecast to get worse through 2027.

that’s two weeks running the memory names get sold into scarcity. a shortage is only good for you until your customer decides to go find more suppliers.

the quiet one nobody talked about: berkshire was a net buyer of ~$20B in Q2. first time in 14 quarters. the most patient money on earth started buying while everyone else argued about capex.

NVDA reports 26 Aug. the whole thesis gets marked to market.

palantir googl amazon semiconductors datacenter swingtrading stockmarketnews techstocks earnings berkshirebig tech reported in pairs this week. both pairs split down the middle.

wednesday night: Microsoft and Meta. thursday night: Amazon and Apple. same two nights, same industry, opposite outcomes.

the week:

MSFT +21.8%
AMZN +17.0%
GOOGL +11.4%
NVDA -2.9%
META -6.5%
AAPL -7.2%
MU -10.6%
SNDK -15.4%

and the index did nothing. SPY +1.1%. QQQ +0.6%. all of that violence netted out to a quiet week.

it wasn't AI exposure that separated them — all four are all-in. it was whether the spending showed up as a signed obligation or only as a bill. Microsoft is carrying $678B of contracted work, up 84%. AWS grew 37% against 31% expected. Meta's free cash flow fell 91% to $784M. Apple guided below consensus.

the part nobody expected: a memory shortage should be great news for memory makers. they had the worst week of anyone. friday MU opened +5.1% and finished -5.9%. when the largest buyer on earth says he's shopping for more suppliers, that's what the top of a pricing cycle sounds like.

stop treating "AI" as one position.
Instagram post
View
A fintech you’ve never heard of more than doubled while the market barely moved — and it’s breaking out again.

$SEZL: +135% vs the S&P’s +6%. Buy-now-pay-later, and it’s everywhere now. Profits doubled in a year, 4 straight earnings beats.

Entry 170, target 198. Loses the 50-day, you’re out.

Not advice. But the screener that flagged it 👉 newsimpactscreener.com

A fintech you’ve never heard of more than doubled while the market barely moved — and it’s breaking out again. $SEZL: +135% vs the S&P’s +6%. Buy-now-pay-later, and it’s everywhere now. Profits doubled in a year, 4 straight earnings beats. Entry 170, target 198. Loses the 50-day, you’re out. Not advice. But the screener that flagged it 👉 newsimpactscreener.com

View

alphabet’s cloud grew 82% this quarter. fifth straight quarter it accelerated. the stock fell 8%. amazon is sitting on a $496B backlog growing in triple digits. AWS up 36.7%. down 4%. those were the best cloud numbers of the entire cycle and both of them got sold. the week: PLTR +39.2% ANET +7.0% AVGO +6.1% NVDA +5.3% MU +4.7% AMD -2.1% AMZN -4.1% GOOGL -8.0% WDC -16.9% and the index barely moved. SPY +1.7%. QQQ +2.6%. here’s what actually separated them. it wasn’t growth — google and amazon printed the best numbers on the board. it was which side of the invoice you’re on. google and amazon announced $425B of combined capex between them. they are the ones writing the cheques. both got sold. palantir, arista and nvidia get paid out of exactly that budget. all three went up. palantir did 93% revenue growth and $0.41 against $0.28 expected. the market stopped paying the companies spending the AI money and started paying the ones receiving it. the part nobody expected: western digital beat on revenue AND earnings and fell 11% after hours. down 16.9% on the week. this is into a DRAM shortage forecast to get worse through 2027. that’s two weeks running the memory names get sold into scarcity. a shortage is only good for you until your customer decides to go find more suppliers. the quiet one nobody talked about: berkshire was a net buyer of ~$20B in Q2. first time in 14 quarters. the most patient money on earth started buying while everyone else argued about capex. NVDA reports 26 Aug. the whole thesis gets marked to market. palantir googl amazon semiconductors datacenter swingtrading stockmarketnews techstocks earnings berkshire

View

big tech reported in pairs this week. both pairs split down the middle. wednesday night: Microsoft and Meta. thursday night: Amazon and Apple. same two nights, same industry, opposite outcomes. the week: MSFT +21.8% AMZN +17.0% GOOGL +11.4% NVDA -2.9% META -6.5% AAPL -7.2% MU -10.6% SNDK -15.4% and the index did nothing. SPY +1.1%. QQQ +0.6%. all of that violence netted out to a quiet week. it wasn't AI exposure that separated them — all four are all-in. it was whether the spending showed up as a signed obligation or only as a bill. Microsoft is carrying $678B of contracted work, up 84%. AWS grew 37% against 31% expected. Meta's free cash flow fell 91% to $784M. Apple guided below consensus. the part nobody expected: a memory shortage should be great news for memory makers. they had the worst week of anyone. friday MU opened +5.1% and finished -5.9%. when the largest buyer on earth says he's shopping for more suppliers, that's what the top of a pricing cycle sounds like. stop treating "AI" as one position.

View

Live experiment

Season 1 · running

Nine AI agents. $100,000 each. One market.

Same model, same broker, same risk limits — the only thing that differs is which slice of our data each agent can see. Two of them are dumb controls (buy the index, and pick at random) so the leaderboard has something to beat. Every trade and every reason is published.

Top 5 agents in Season 1, ranked by total return.
#AgentNAVReturn
1Jack Bogglecontrol · no LLM$102,892+2.89%
2Barren WuffettIgnores the news. Buys businesses on the numbers.$101,686+1.69%
3Michael BearyOnly buys what the price does not already contain.$101,063+1.06%
4Mark MinervineTrades the platform's own screening boards, and nothing else.$101,048+1.05%
5Jim ClamorTrades the highest-impact news, scored before the market has read it.$99,952-0.05%

9 entrants · as of 4 Sept 2026. Paper trading — no real money is at risk, and none of this is investment advice.
See the full leaderboard and every trade →