Verdict: nothing in Tier 1 survives. The signed-volume proxy fails twice, for the same underlying reason — it carries the signs of the returns it is supposed to explain. Against ρ it measures nothing; against the impact law it measures itself.
Correction (supersedes the first version of this document). An earlier draft reported the square-root impact law as replicating with Y = 0.555, and concluded that
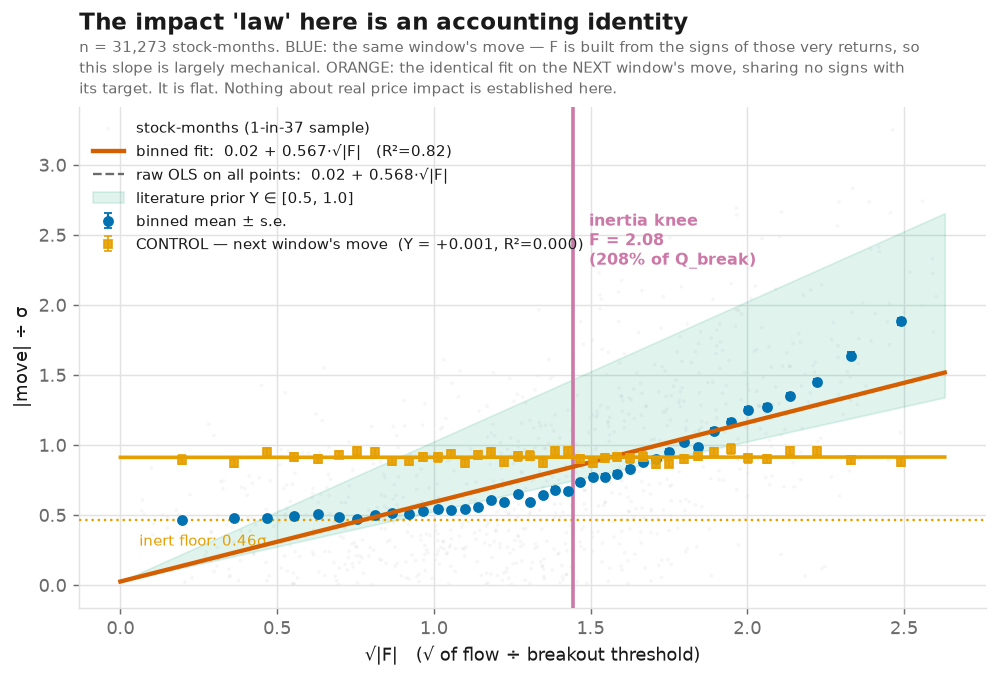
Q_breakwas empirically calibrated. That was wrong. The fit was contemporaneous —Fis built fromsign(r_t)of the same days whose move sits on the left-hand side — so it was largely an accounting identity. The forward control added since (§ "The one apparent success was circular") returns Y = +0.001.Q_breakis not calibrated, and the "3.2 × ADV to move 1σ" figure from that draft should be discarded.
Run: 129 monthly cross-sections (2014-01 → 2026-06), 847 mid-cap names per cross-section, 111,695 stock-months, US common stock $2–50B. Artifacts: stage1.json, panel.csv.gz, preregistration.json
The finding, in one table
| quantity | measured | what it should be |
|---|---|---|
| ρ — AR(1) of weekly signed dollar flow | −0.038 (median −0.041, sd 0.326) | > 0 if flow has inertia |
Volume is strongly persistent. Direction is not. f_t = sign(r_t)·DollarVolume_t
multiplies a highly persistent magnitude by an essentially unpredictable sign,
and the product inherits the sign's lack of persistence. There is no inertia in
this proxy to measure.
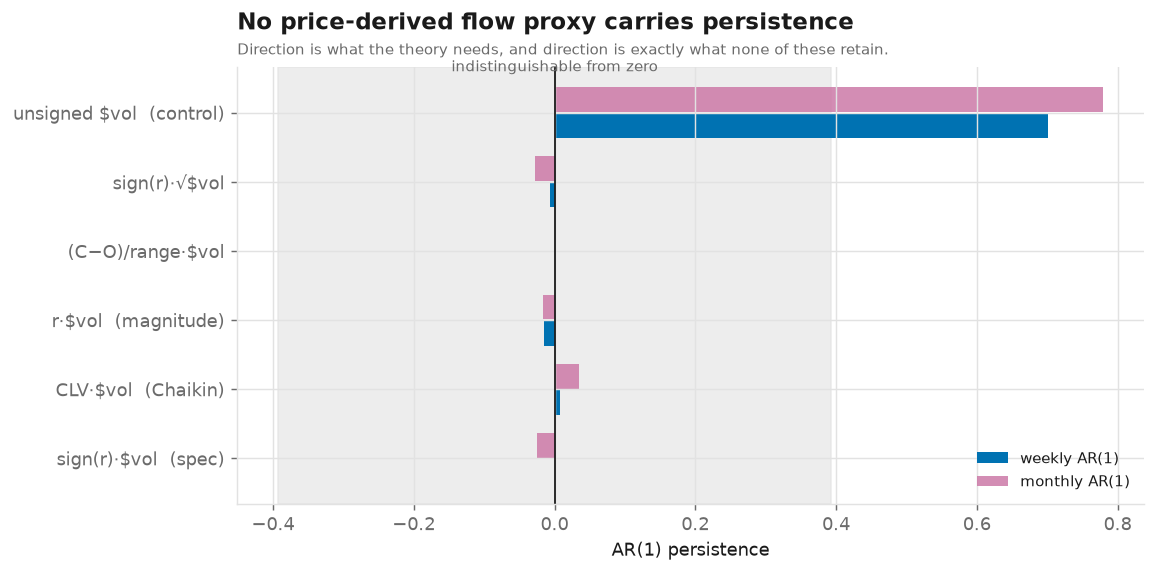
This is not specific to the spec's construction. Seven proxies were tested:
| proxy | weekly AR(1) | monthly AR(1) |
|---|---|---|
sign(r)·$vol (spec Tier-1) | +0.008 | −0.016 |
No price-derived flow proxy carries persistence at any frequency tested.
The trap that was avoided
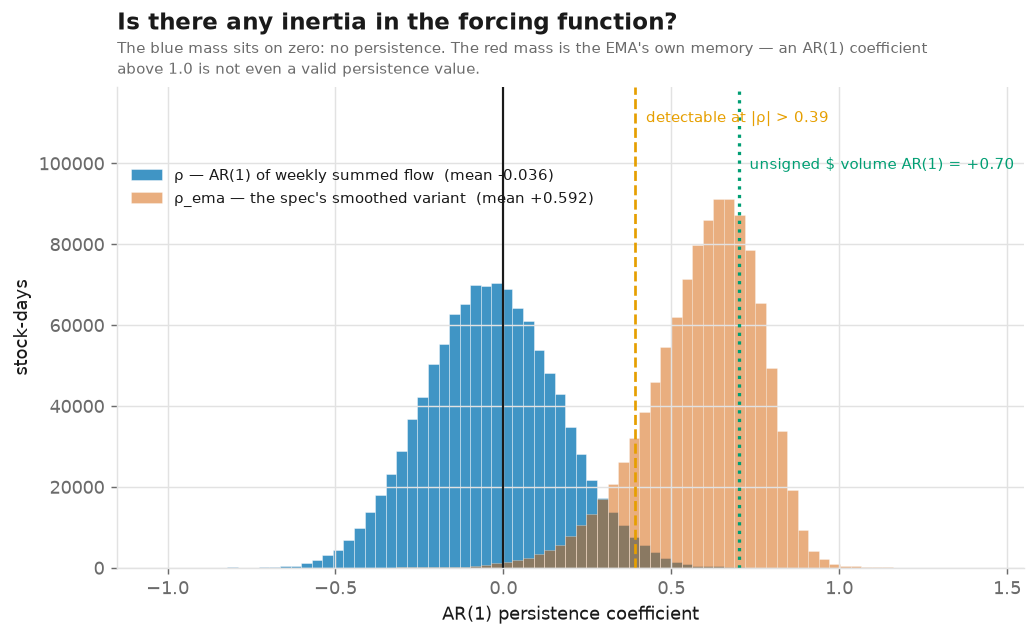
The spec defines ρ as the AR(1) of the EMA-smoothed flow. Measured:
rho      (weekly summed raw flow)   mean  -0.038
rho_ema  (spec's smoothed variant)  mean  +1.191
An EMA induces autocorrelation by construction. On synthetic white noise the same estimator returns ρ_ema ≈ +0.4–0.6 while raw ρ ≈ 0 — this is pinned as a regression test.
Run as written, the spec would have produced a confident, plausibly-dispersed inertia measure of ≈0.6, and a T_half of ≈10 days — which is the EMA half-life that was chosen, not anything about the stock. Every downstream result would have been an artifact of the filter. On real data it comes out at 1.19, above the 1.0 that an AR(1) persistence coefficient can even validly take.
The one apparent success was circular
The contemporaneous fit looks like a textbook impact law:
|move_t| / σ = 0.025 + 0.567·√|F_t| binned R² = 0.825
Y = 0.567 sits inside the literature's 0.5–1.0 band. A piecewise fit even finds a clean knee at F = 2.08 — slope +0.176 below it, +1.089 above, 93% better than a straight line. It is exactly the shape the brief predicted.
It is an artefact. F = Σ sign(r_t)·$vol_t over the same 20 days whose move
is the dependent variable. A large |F| requires the daily signs to agree; a
large 20-day move also requires the daily signs to agree. The two quantities
are linked by construction, and the regression measures that link.
The control is decisive — identical fit, but on the next window's move,
which shares no return signs with F:
| slope Y | R² | p | n | |
|---|---|---|---|---|
| contemporaneous (same window) |
Flat. The forward intercept is 0.911 — essentially the random-walk expectation
for E|move|/(σ√T). Price movement in the next window is independent of F.
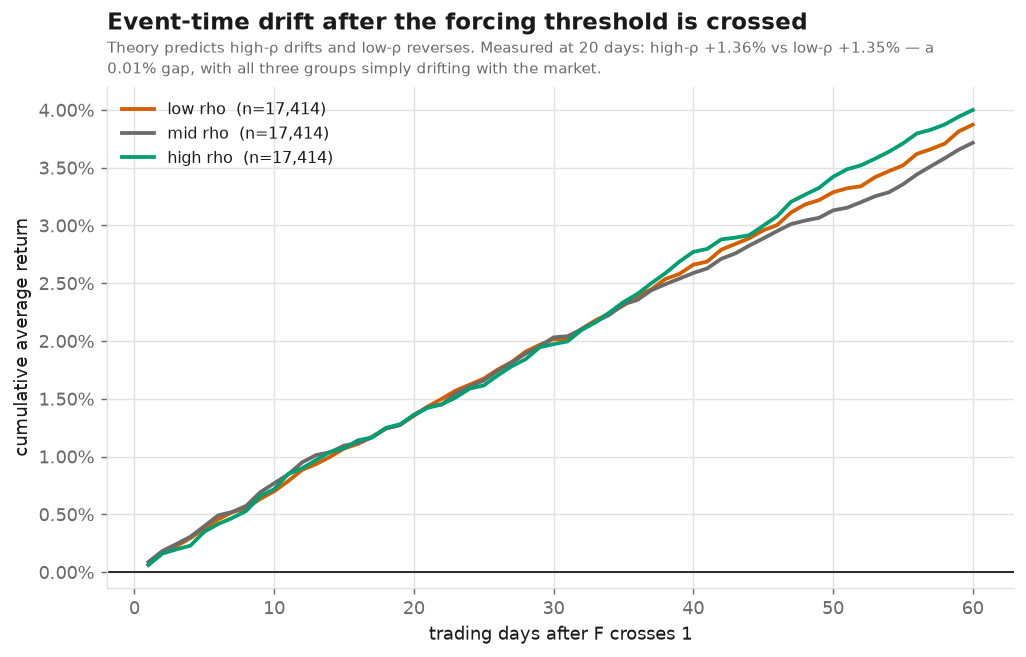
Q_break is therefore not calibrated by this exercise, and no inertia-breaking
threshold has been established. The knee at F = 2.08 describes the geometry of
the identity, not a property of the market.
Everything conditional on ρ is null
| test | result |
|---|---|
| impact law, forward control | Y = +0.001, p = 0.92 |
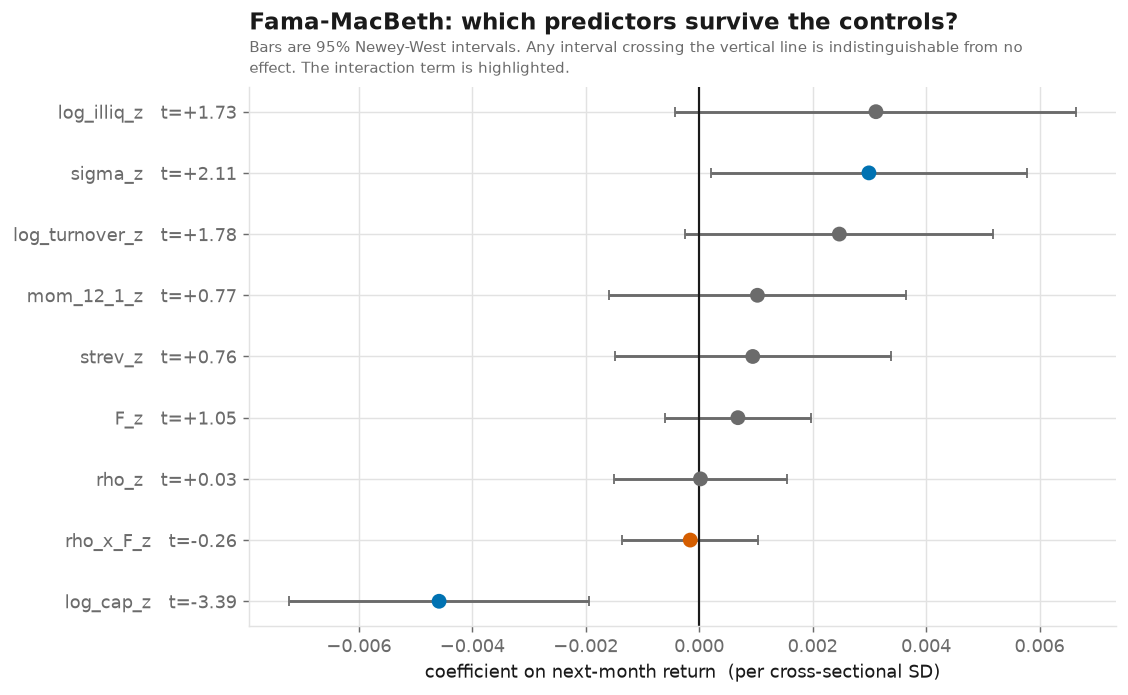
| ρ×F interaction (M5, all controls) | coef −0.00016, |
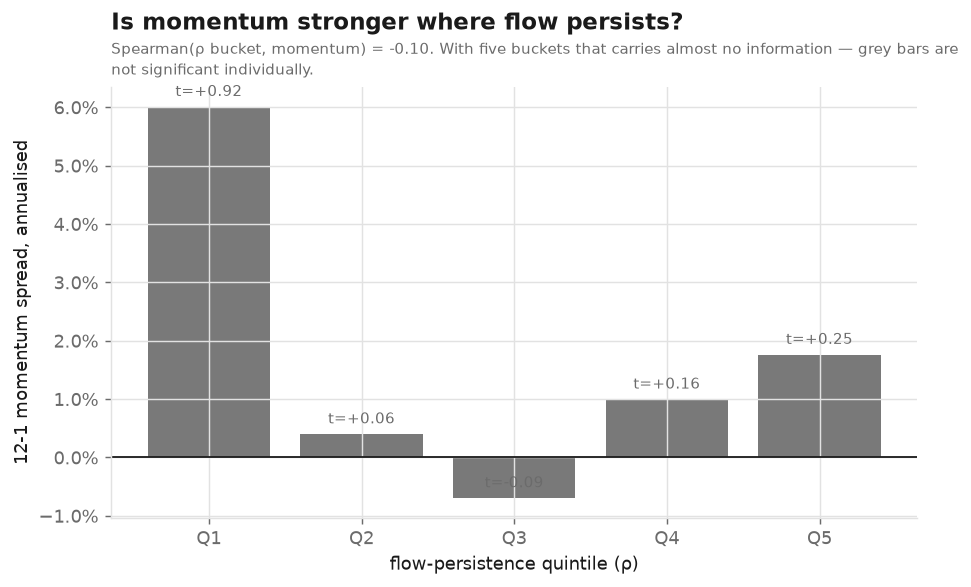
T1 (momentum increasing in ρ) nominally passed on the full universe with a Spearman of +0.60, but flipped to +0.40 on a 250-name subset. With 5 buckets a Spearman of 0.6 has p ≈ 0.35 — it was never evidence.
The placebo test (T4) is reported as VACUOUS, not as a pass or a fail: when the real signal is itself null there is nothing for re-signed volume to fail to reproduce.
Sensitivity — how strong is this negative?
Weaker than it looks, and the test suite says so. A control panel with AR(0.55) daily returns — persistence far beyond anything real equities exhibit — survives the sign-and-aggregate transform as only ρ ≈ +0.09. The proxy attenuates persistence heavily.
So the honest reading is: this proxy could not detect flow inertia even if it were there. That is a statement about the instrument, not about the market.
Where this leaves the thesis
The mechanism is untested, not disproved — but the reason both tests failed is now one reason, not two: every Tier-1 quantity is a function of the return signs it is meant to explain. ρ inherits the sign's lack of persistence; Y inherits the sign's mechanical link to the move. No amount of care downstream fixes an input that is derived from the output.
That makes the next step unambiguous: the flow measure has to come from somewhere other than price.
Three routes:
1. Tier 2 — mechanical flow. BUILT AND TESTED. It fails too, at the data layer.
Update, after building it: FMP's implied share counts cannot support a daily flow series. The initial validation asked the wrong question.
The check I ran first was "does implied SO ever change, or is it price-scaled stale data?" Over a 2024-2026 sample, SPY showed 7 change-days in 41 sessions and passed. The question that mattered was how often, over the full window:
| ETF | sessions with a share-count change (2021-06 → 2026-06) |
|---|---|
| SPY | 0.5% |
| VOO | 0.7% |
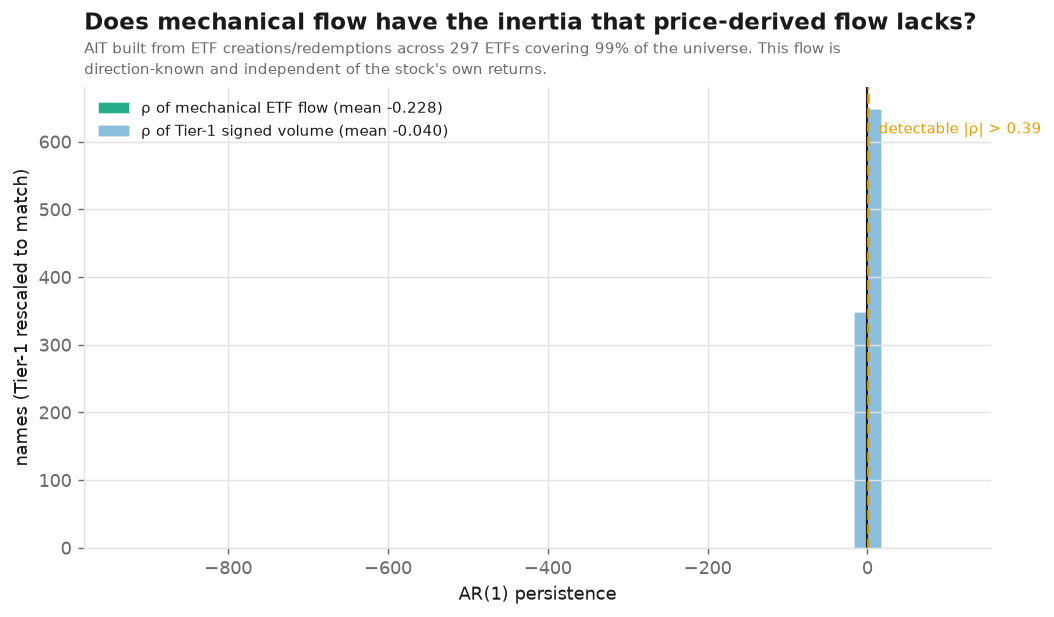
Across 300 ETFs, 94.5% of days carry zero reported flow. The consequence is
subtle and it nearly produced a false positive: a 95%-zero series has a strongly
negative weekly autocorrelation purely from the zero inflation. The first run
of the Tier-2 test duly reported ρ = −0.23 and my own pass criterion, which
tested |ρ|, called it a PASS — scoring a mean-reverting series as strong
evidence of inertia, the exact opposite of the mechanism.
Both were fixed: the verdict now requires ρ to be positive, and the validation gate now measures the update rate and reports daily-viable and monthly-viable separately. On this data, no ETF is daily-viable; a handful are monthly-viable.
That leaves two honest options: issuer daily-holdings files (iShares, Vanguard and SSGA do publish genuinely daily) — Workaround B, needing a scraper — or running AIT at monthly frequency on the ~5 names per month that update, which is consistent with a monthly rebalance but very thin.
The universe machinery is done and correct, which is worth keeping either way:
listed & cached                    2056
after ADR / REIT / SPAC exclusion  1938
after dual-class dedupe            1919
after ETF ownership >= 3%          1076     <- removes 843 names
names ever eligible                1032
names eligible per day (median)     647
2. (superseded) Tier 2 — the gate as originally assessed. The implementation doc's own validation item #1 was run:
SPY  41 sessions, 11 distinct implied-SO levels, 7 days with >0.1% SO change
IWM  41 sessions, 13 distinct levels,  9 days
XLK  41 sessions,  6 distinct levels,  5 days
FMP's ETF market cap is not price-scaled stale data — it steps on
creation/redemption days. So Flow_etf,t = ΔSO_t · NAV_t is derivable, and
/api/v3/etf-stock-exposure/{symbol} returns the wᵢⱼ weight matrix in one call
per stock. Tier-2 AIT is buildable from FMP alone (Workaround A, not C).
This is genuinely directional, mechanical flow — the thing the theory is actually about — rather than a sign attached to volume.
Constraint to decide on: historical-market-capitalization only reaches
back to 2021-06 on this plan, so Tier 2 gets ~5 years and ~60 monthly
cross-sections. That is thin for a factor test and it spans one regime.
Issuer daily-holdings files (Workaround B) would extend it but need a scraper.
2. Institutional-ownership flow — blocked.
/api/v4/institutional-ownership/symbol-ownership returns 403 on this plan.
The FMP doc's "upgrade to Tier-2 breadth flow without parsing 13Fs" route is not
available without a plan change.
3. Statistical arbitrage / pairs — a different and better-posed use of the same idea. Directional flow is unmeasurable from price, but relative flow between two cointegrated names does not require getting market direction right. The inertia question becomes the one that actually decides a pairs trade: when a spread diverges, is the divergence flow-driven (persistent — ride it) or liquidity-driven (transient — fade it)?
Note this route now needs Tier-2 flow too: with Q_break uncalibrated, the
discriminator would have to come from mechanical flow rather than from the
price-derived threshold.
Reproduce
Pre-registration is written before the data is touched; the verdict applies a Bonferroni haircut over the 11 registered variants (α = 0.00455). The three exploratory regressions reported above were run after and are labelled as such.