

Get signals before everyone else does
Cut through endless headlines. See which stories and themes are gaining traction so you know what to read first—without a terminal or a research team.
See what a share price already pays for — and what it refuses to pay for — before you take the other side. Free, no account. Plus two tools that bring the signals to you.
Start free in seconds — pick one, or all three
Open any ticker and read the story its price already tells: what the market is paying for, what it declines to pay for, and the one question that settles it.
Platform-run Stage 2 setups, breakouts and fundamentals. Subscribe once; results hit your inbox.
You choose the exact tickers and tags — we send a daily PDF of just their news, summaries and market impact, an hour before the open. Built around your watchlist, no one else’s.
See it first
A genuine sample of each free tool — the morning briefing PDF, the latest momentum screening, and a live price narrative. No account needed.
Narrative trading
A share price is a vote on a set of claims. Narrative trading is reading that vote before you take the other side — what the price already pays for, what it refuses to pay for, and the single question that settles the difference. We reconstruct it from every published analyst model on the name, the reported segments and a reverse-DCF. Free on 379 tickers, no account.
Anything widely reported is already in the number. Buying a story everyone has read is paying full price for old news.
The rejected models are the opportunity. They name the specific upside — and downside — the market is currently declining to fund.
Most disagreements come down to a single variable. Know which one, and you know exactly which headline to act on and which to ignore.
AAPL
20 published analyst models · as of 2026-08-31
Where the price sits
How it works
Track narratives as they build—AI infrastructure, rate expectations, energy policy—before they become headlines everywhere.
Get a clear picture of which companies sit closest to a story so you know where to look, not just what happened.
Filter by the factors you care about—growth, value, sector, risk—and keep your process consistent without manual spreadsheets.
Why it works
You don't need a desk full of monitors. Follow themes, see exposure, and narrow ideas—before the market has already moved.
Cut through endless headlines. See which stories and themes are gaining traction so you know what to read first—without a terminal or a research team.
Turn "what's everyone talking about?" into "what might affect the names in my brokerage or IRA?"—before the connection is obvious everywhere else.
Whether you check in daily or on weekends, less doom-scrolling, fewer "what did I miss?" moments, and a shorter path from headline to decision.
What you get
Watch how narratives build over time so you're not reacting to every headline in isolation—or missing the ones that actually matter.
Get a clear picture of which companies and industries sit closest to a story—before the market has priced it in.
Focus on the factors that matter to you—growth, value, risk, sectors—and keep your process consistent without spreadsheets you maintain by hand.
Free market screenings
Platform-managed screenings — Stage 2 setups, technicals, fundamentals — run on a schedule. Subscribe once and the results land in your inbox and Telegram, no setup required.
Stocks positioned to benefit from persistently high inflation and higher-for-longer rates — precious metals, energy, commodities & materials, pricing-power staples, energy infrastructure, rate-beneficiary financials and inflation-protected proxies — each validated by price momentum and real inflation-news exposure.
View screening →Stocks positioned to benefit from an Iran / Strait-of-Hormuz supply shock — oil & gas, oil services, defense & aerospace, tankers & shipping, uranium & energy security, and safe-haven — each validated by price momentum and real crisis-news exposure.
View screening →Pricing
Price increases every 100 subscribers. Early subscribers lock in their rate forever.
$99/yr · lock in forever
Real-time screening, locked at this price for life.
Your price is locked for life. Cancel any time — but once you cancel, the founder rate is gone.
Straight answers
Retail and self-directed investors who manage their own accounts—taxable brokerage, IRA, or both—and want news tied to opportunities, not noise.
Most screeners start with static filters. News Impact Screener starts with what's happening in the world and shows what it might push on in the market—so you're not the last to know.
What would it mean to catch major news before everyone else? Less scrambling, fewer "I should have seen that coming" moments, and a watchlist you actually understand.
Early access
It seems like you want fast, reliable insight—without digging through hours of news. Join the list and get signals before the market reacts. Built for people who invest their own money and want context, not chaos.
Free. No spam. Takes 30 seconds.
| Symbol | Sector | Sub Sector | RS Rank |
|---|---|---|---|
| BAC | Financial Services | Banks - Diversifi… | 87 |
| BNS | Financial Services | Banks - Diversifi… | 87 |
| BOW | Financial Services | Insurance - Prope… | 87 |
| FBP | Financial Services | Banks - Regional | 87 |
| IDT | Communication Ser… | Telecommunication… | 87 |
| ING | Financial Services | Banks - Diversifi… | 87 |
| LITE | Technology | Communication Equ… | 87 |
| PLBC | Financial Services | Banks - Regional | 87 |
AAPL
20 published analyst models
The market is 11% below the median target — more cautious than the analysts.
The market is 11% below the median target — more cautious than the analysts.
The price sits at the 25th percentile of the 20 published models, leaning bearish versus the median $360 target, and requires revenue growth of 17.3% annually—far above the 6.4% just delivered—meaning the market is already paying for significant acceleration.
The price pays for
The price refuses to pay for
What the disagreement turns on
Whether Apple can accelerate its revenue growth to the 17%+ the price requires, primarily through AI-driven upgrades and Chinese market expansion, which can only be partially settled by tracking consumer attention and unit volumes.
Written by a language model from the published models, the reported segments and a reverse-DCF — not a recommendation, and not a house view.
The short-side inverse of NIS Momentum, applying Minervini SEPA / O'Neil CAN SLIM to the SHORT side. Targets FORMER LEADERS rolling over into a Stage-4 decline — distribution and failure — not perennial losers already at new lows. The whole screen is gated on a bearish market regime (only runs when the S&P is below its 200-day). Pipeline: 0. Market regime gate: skip entirely unless the S&P 500 is below its 200-day MA. 1. Universe: all listed NYSE + NASDAQ tickers. 2. Inverted pre-screen: actively traded, price < SMA200, SMA50 < SMA200, at least 25% below the 52-week high, AND weak RS (bottom ~30%, RS < 30). 3. Stage-4 decline template — all conditions required: • close < SMA50 < SMA150 < SMA200 • SMA200 falling (20-day slope confirmation) • close at least 25% below the 52-week high, and that high is stale (made months ago — peak at least ~5 weeks old) • RS weak (RS < 30 — the inverse of the long side's RS > 70) 4. Former-leader gate (most important): ran 100%+ from a prior trough into its peak over the last 1–3 years, and the peak is at least ~5 weeks old (O'Neil: best shorts are 5–15 weeks after the top, not at the peak). 5. Distribution volume: down-days heavier than up-days over 50 sessions (up/down-volume ratio at or below 0.85 — the inverse of accumulation). 6. Decelerating fundamentals: EPS momentum not accelerating AND (EPS SMA turning down OR a recent earnings miss) — deceleration/disappointment, not absolute badness. 7. Liquidity floor: enough average daily dollar volume to borrow and exit. 8. A ticker is reported only if it passes EVERY technical AND fundamental gate. Output includes the symbol, sector, sub-sector, RS, all Stage-4 technical flags, former-leader/timing metrics (prior-advance %, % below the high, peak age, distance to the declining 50-day = overhead resistance), volume/liquidity, and the deceleration fundamental flags. Squeeze risk (high short interest / days-to-cover) and the exact rally-into-resistance entry are assessed downstream by the AI analysis pass.
Daily regime reads, top-story breakdowns, and watchlist setups — the screener's signal, in 30 seconds a day.

google's cloud grew 82% this quarter. fifth straight quarter it accelerated. the stock fell 8%. amazon did the same thing — AWS +36.7%, a $496B backlog growing triple digits. down 4%. those were the best cloud numbers of the entire cycle and both of them got sold. meanwhile: PLTR +39.2% ANET +7.0% NVDA +5.3% notice what those three have in common. they all sell TO google and amazon. google and amazon announced $425B of capex between them. the market stopped paying whoever spends the AI money and started paying whoever receives it. being the customer is the bad trade right now. the part nobody expected: western digital beat on revenue AND earnings and still finished -16.9% — into a DRAM shortage that's forecast to get worse through 2027. a shortage is only good for you until your customer goes shopping for more suppliers. nvda reports the 26th. that's when the whole thesis gets marked to market.
View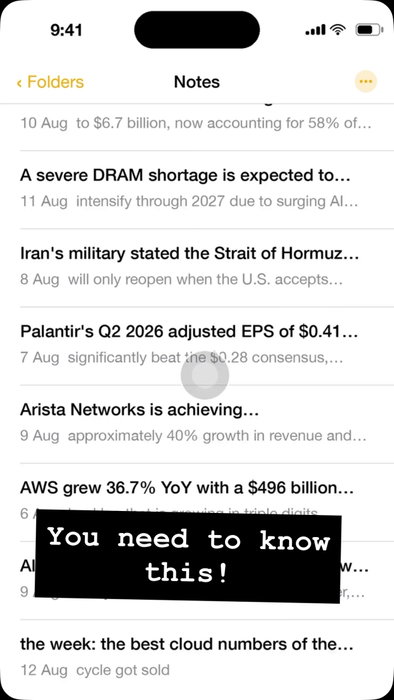
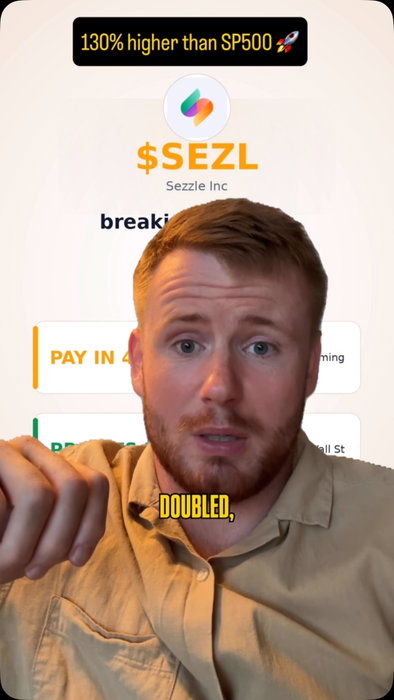
A fintech you’ve never heard of more than doubled while the market barely moved — and it’s breaking out again. $SEZL: +135% vs the S&P’s +6%. Buy-now-pay-later, and it’s everywhere now. Profits doubled in a year, 4 straight earnings beats. Entry 170, target 198. Loses the 50-day, you’re out. Not advice. But the screener that flagged it 👉 newsimpactscreener.com
Viewalphabet’s cloud grew 82% this quarter. fifth straight quarter it accelerated. the stock fell 8%. amazon is sitting on a $496B backlog growing in triple digits. AWS up 36.7%. down 4%. those were the best cloud numbers of the entire cycle and both of them got sold. the week: PLTR +39.2% ANET +7.0% AVGO +6.1% NVDA +5.3% MU +4.7% AMD -2.1% AMZN -4.1% GOOGL -8.0% WDC -16.9% and the index barely moved. SPY +1.7%. QQQ +2.6%. here’s what actually separated them. it wasn’t growth — google and amazon printed the best numbers on the board. it was which side of the invoice you’re on. google and amazon announced $425B of combined capex between them. they are the ones writing the cheques. both got sold. palantir, arista and nvidia get paid out of exactly that budget. all three went up. palantir did 93% revenue growth and $0.41 against $0.28 expected. the market stopped paying the companies spending the AI money and started paying the ones receiving it. the part nobody expected: western digital beat on revenue AND earnings and fell 11% after hours. down 16.9% on the week. this is into a DRAM shortage forecast to get worse through 2027. that’s two weeks running the memory names get sold into scarcity. a shortage is only good for you until your customer decides to go find more suppliers. the quiet one nobody talked about: berkshire was a net buyer of ~$20B in Q2. first time in 14 quarters. the most patient money on earth started buying while everyone else argued about capex. NVDA reports 26 Aug. the whole thesis gets marked to market. palantir googl amazon semiconductors datacenter swingtrading stockmarketnews techstocks earnings berkshire
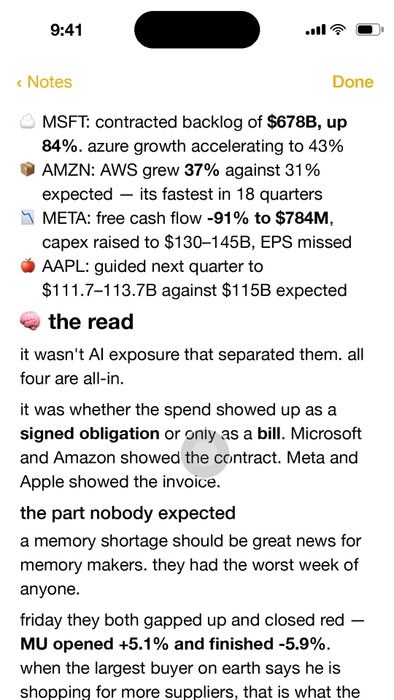
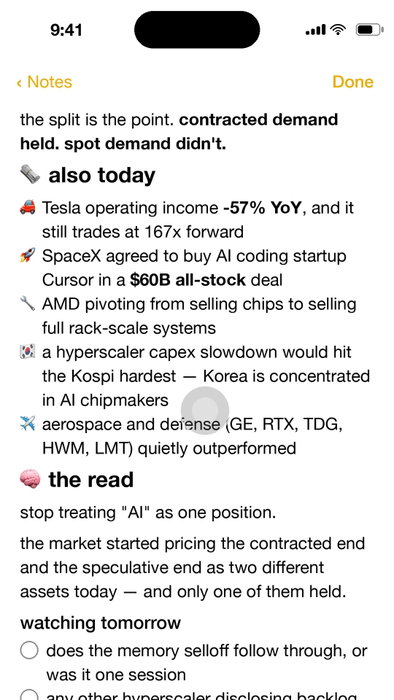
Viewbig tech reported in pairs this week. both pairs split down the middle. wednesday night: Microsoft and Meta. thursday night: Amazon and Apple. same two nights, same industry, opposite outcomes. the week: MSFT +21.8% AMZN +17.0% GOOGL +11.4% NVDA -2.9% META -6.5% AAPL -7.2% MU -10.6% SNDK -15.4% and the index did nothing. SPY +1.1%. QQQ +0.6%. all of that violence netted out to a quiet week. it wasn't AI exposure that separated them — all four are all-in. it was whether the spending showed up as a signed obligation or only as a bill. Microsoft is carrying $678B of contracted work, up 84%. AWS grew 37% against 31% expected. Meta's free cash flow fell 91% to $784M. Apple guided below consensus. the part nobody expected: a memory shortage should be great news for memory makers. they had the worst week of anyone. friday MU opened +5.1% and finished -5.9%. when the largest buyer on earth says he's shopping for more suppliers, that's what the top of a pricing cycle sounds like. stop treating "AI" as one position.